All together |
  
|
All together |
|
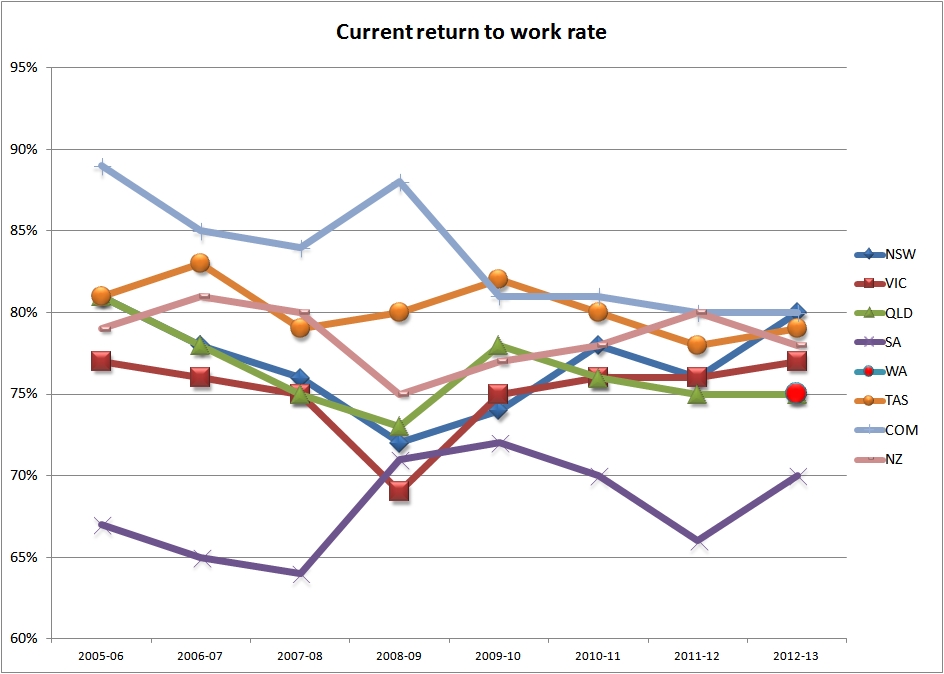
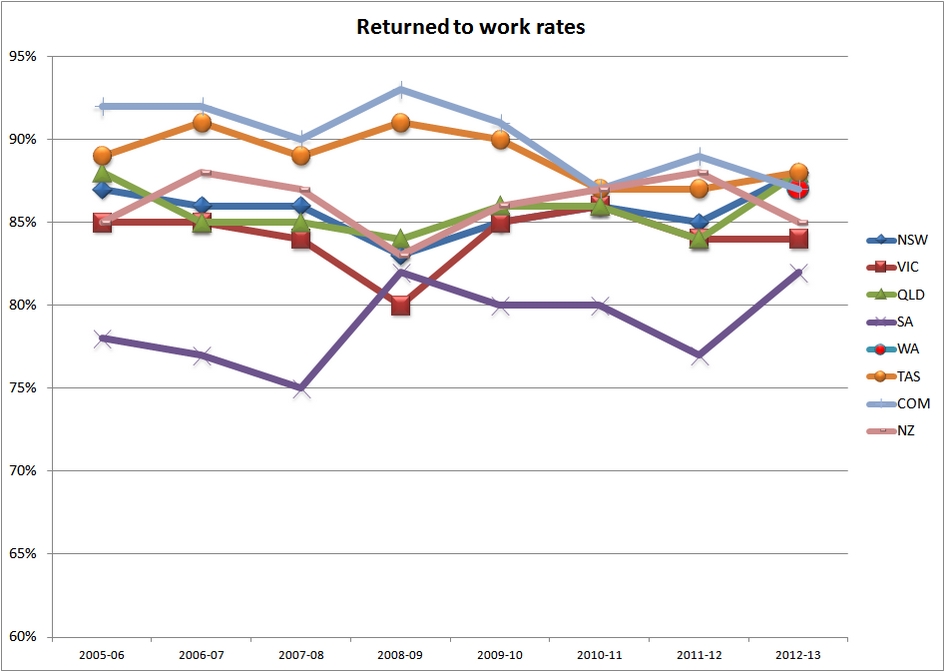
The two graphs below show the same results presented in a different way.
The graphs allow better comparison of the return to work results over time across the various jurisdictions.
The Returned to Work Rate is the percentage of cases where the worker returned to work at some stage between the time of the lodging their claim and the time of the survey. They may or may not have remained at work. The Returned to Work Rate is equivalent to the Return to Work Rate recorded in earlier versions of the Monitor.
The Current Return to Work Rate is the percentage of workers who had returned to work and were working at the time of the survey, 7 to 9 months after submitting their claim. The Current Return to Work Rate is equivalent to the Durable Return to Work Rate reported in earlier versions of the monitor.