
RTW helps and hindrances

In this feature reviewing the results of the annual Heads of Workers' Compensation Authorities RTW Monitor, we explore the factors that help return to work, and increase worker satisfaction with the system.
As you will see below, RTW plans seem to make durable RTW more likely, and when workers are involved in the development of these plans, and assisted in their implementation, durable RTW becomes even more probable.
In Australia, doctors are still seen by workers as the people most likely to provide valuable support during the RTW process, although workplaces are increasingly seen as helpful too.
Nevertheless, while nearly 1/2 of Australian workers interviewed for the RTW Monitor said that no one interfered with their RTW, nearly 1/3 said that someone in the workplace had made their RTW more difficult, and 1/10 identified the insurer as the source of difficulties. Interestingly, the quality of service provided by insurers is perceived to be highest in jurisdictions such as Queensland, where there is a high degree of centralisation.
In 2009-10 32% of injured employees reported developing a RTW Plan AND being given assistance to follow the plan.
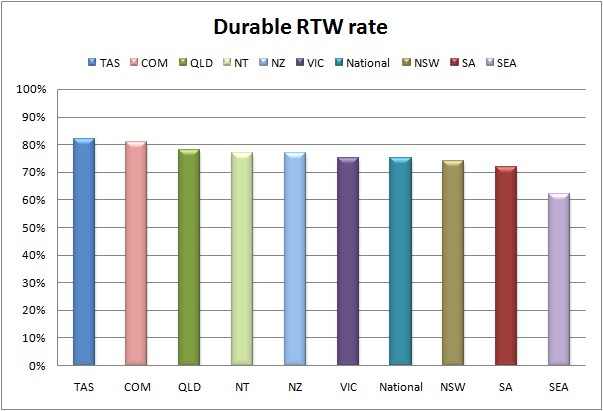
Durable RTW Rate
Tasmania has the highest rate of durable return to work and Seacare the lowest.
The national average in 2009-10 is 75%, reversing the downward trend over the last four years.
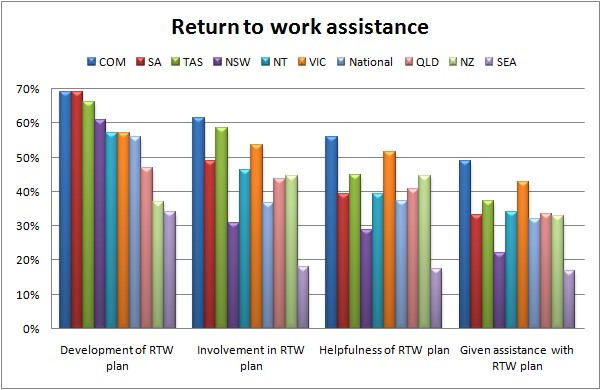
RTW Assistance
The chart below explores the percentage of injured employees who:
- Said a return to work plan had been developed to help their return to work;
- Had a return to work plan AND said they were involved in the plan development;
- Had a return to work plan AND said the plan was helpful; and
- Had a return to work plan AND said they were given assistance to follow the plan.
The national average for workers with an injury to have a return to work plan developed for them was 56%, up from 53% in 2008-09.
Injured workers who had a durable RTW were more likely to have a RTW plan developed compared to those with non-durable RTW and no RTW.
Between 20% and just over 60% of injured employees advised they had a return to work plan developed AND they had been involved in the development of the plan, with the Australian average at 37%.
Involvement in the development of the plan was higher for those with a durable RTW compared to non-durable RTW and no RTW.
32% of injured employees indicated they had a return to work plan developed AND they had been given assistance to follow the plan.
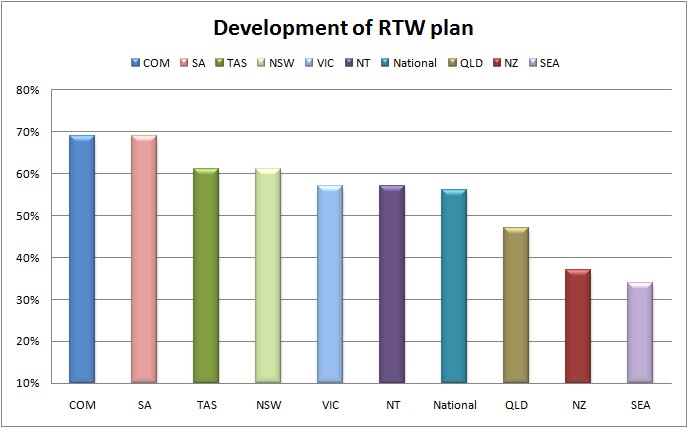
The charts below examines the same information, ordered by jurisdiction.
The first graph shows the percentage of employees who had a RTW plan developed, with employees in Comcare and SA the most likely to have a RTW plan developed.
The graph below shows the proportion of injured employees who had a plan developed, AND were involved, found it helpful and were given assistance in following it.
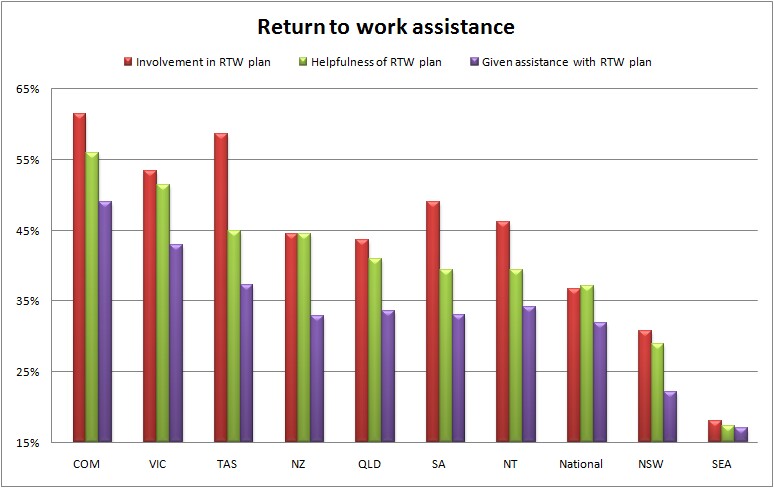
Comcare and Tasmania scored highest in the percentage of people who had a return to work plan and were involved in the development of the plan. These jurisdictions also consistently score high on durable return to work.
Comcare has the highest rate of reporting they had a return to work plan and the plan was helpful, followed by Victoria.
Victoria rates well in terms of helpfulness of the plan, and being given assistance with the RTW plan.
NSW is the major standout, rating consistently below the national average on measures of helpfulness, and particularly poorly on being given assistance with the plan. The proportion of people who have a return to work plan developed is above the national average, however support is missing.
Who was helpful in RTW
Doctors are the people most likely to help return to work in Australia, with the person themselves, a physiotherapist and someone from work also rating as important groups.
There has been a small reduction in the percentage of people indicating their doctor was the most helpful to return to work, and a commensurate increase in someone from work being the most helpful.

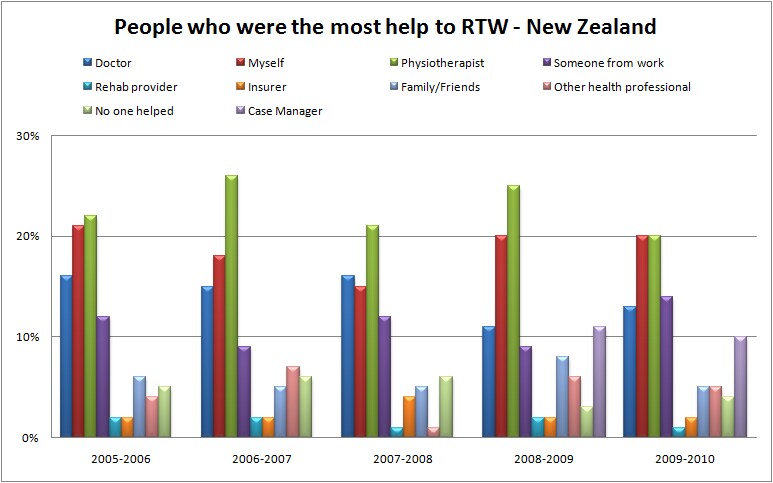
Physiotherapists have been the group considered to be the most help in return to work in New Zealand up until this year. There has been an increase in the proportion of employees reporting someone from work was helpful.
Who was unhelpful in RTW
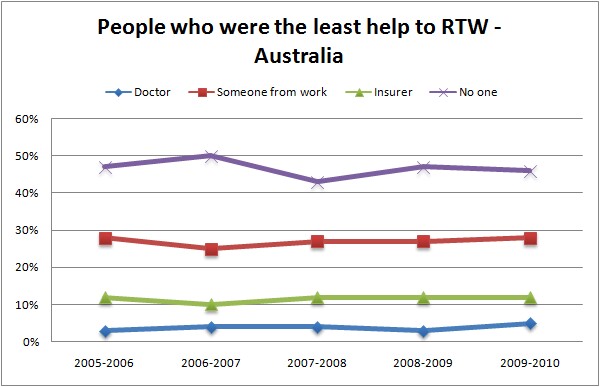
The majority of employees with an injury did not indicate a person who was unhelpful in their return to work.
Just under 30% indicated someone from work was unhelpful, with just over 10% advising an insurer was unhelpful. These results have not materially changed over the last few years.
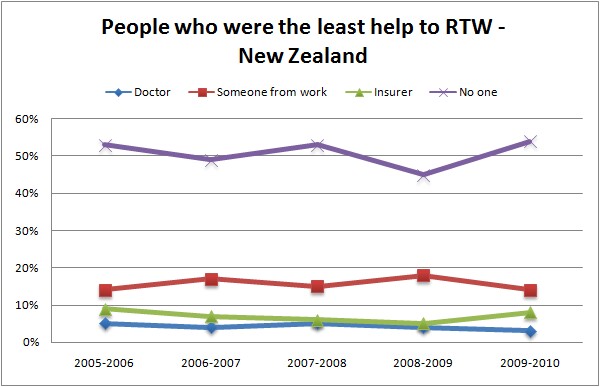
NZ employees are less likely to report someone has been unhelpful in their return to work.
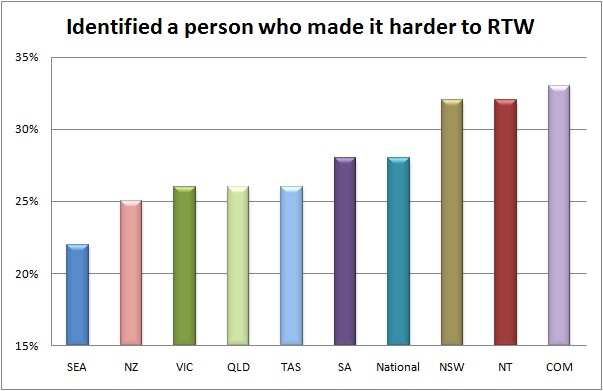
When viewed by jurisdiction, Comcare employees are the most likely to report someone has been unhelpful in their return to work, followed by NSW and NT.
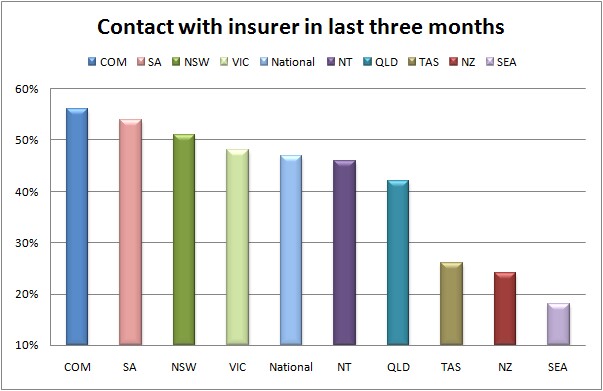
Insurer services
Contact with the insure was most common with Comcare and lowest with Seacare
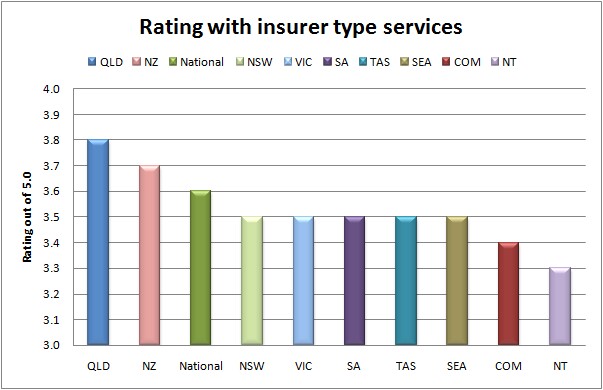
Queensland's central insurer / authority, providing case and claims management, is rated highest on the quality of service provided. This is followed by NZ, with a similar system of the central insurer / authority providing case and claims management.
Northern Territory rates the lowest, with Comcare second lowest.
RTW rates broadly correlate with return to work efforts such as the development of plans, involvement of the employee, and assistance. The systems with the highest return to work rates, such as Comcare and Tasmania, have the best results in terms of development of plans and involvement and assistance with RTW.
Published 04 October, 2010