
The trouble with making it harder - Evidence from the 2011 RTW Monitor

Dr Mary Wyatt and Sean Gleeson
The 2010-11 Return to Work Monitor shows a drop in return to work in previously high performing jurisdictions. And Key Information For Employers.The Heads of Workers' Compensation Authorities have released the annual Return to Work Monitor for 2010-11.
For those new to Return to Work Matters, each year we extract the data available in the monitor, and examine the RTW (return to work) trends across Australia and New Zealand. We also look at the factors that influence RTW.
Yesterday I spoke with Stephen Campbell, who runs Campbell Research and Consulting - the organisation that conducts the surveys and produces the report. Stephen flagged the long standing association between RTW outcomes and whether people felt they had been helped or hindered in their RTW.
And that is a great place to start to review the 2011 Monitor's results.
Over the 2010-11 year, the average RTW rate lifted across Australia and NZ. This average is largely buoyed by improvements in the RTW rate in NSW, Victoria and New Zealand. Some jurisdictions are continuing to struggle, with Comcare and Tasmania recording declines in their RTW rate. South Australia and Queensland RTW rates were static.
The Return to Work Monitor is compiled through a series of in-depth interviews with injured workers. The wealth of information in the Monitor gives us the opportunity to analyse what components of the system are working and what are having a detrimental effect. Each year, respondents are asked about the various people in the RTW process and whether one of them made their RTW harder.
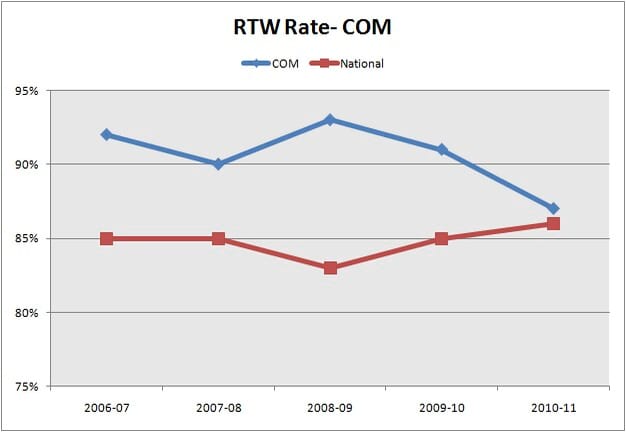
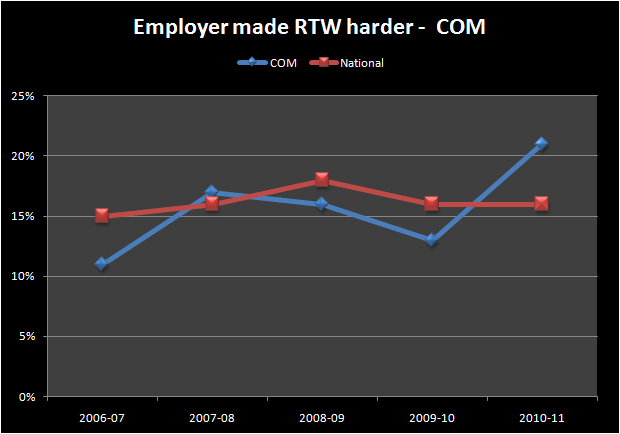
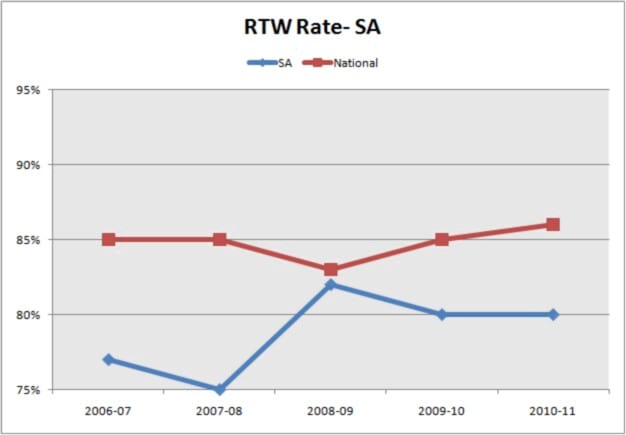
Below, we've compared the RTW rates of various jurisdictions to the percentage of respondents who said their employer made RTW harder.
In the jurisdictions that recorded a fall in RTW over the last two years, there was an increase in the percentage of people who said their employer made RTW harder. The opposite was generally true for jurisdictions which recorded a rise in the RTW rate.
- The blue lines show the jurisdiction (eg WorkSafe Vic, Comcare, etc) and the red-brown lines show the Australian average results.
- The graphs on the left show RTW rates in the jurisdictions (had the person returned to work at some stage between when their claim was lodged and when they were interviewed at about 8 months post claim).
- The graphs on the right (black background) show the percentage of people who reported their employer had made their RTW harder.
Jurisdictions where the return to work rates have declined over the last two years
Comcare's RTW rate has declined substantially over the last two years, from a top-performing 93 percent down to 87 percent. It is now just above the national average.
This has dovetailed with a sharp spike in injured workers who identified their employer as making RTW harder. Respondents answering that their employer made RTW more difficult rose from 13 percent to 21 percent over the last 12 months.
 |
 |
South Australia's RTW rate dropped in the 12 months 2009-10 and has remained static for the year since. This has been matched by a increase in the number of workers stating that their employers made it harder to RTW.
(Note also: in the 2008-09 year RTW rates made a major leap into positive territory in SA. There was a corresponding drop in the percentage of employees who said their employer made RTW harder in that year).
 |
 |
Published 10 September, 2011